Case 1: Underfilm corrosion detection in marine coatings
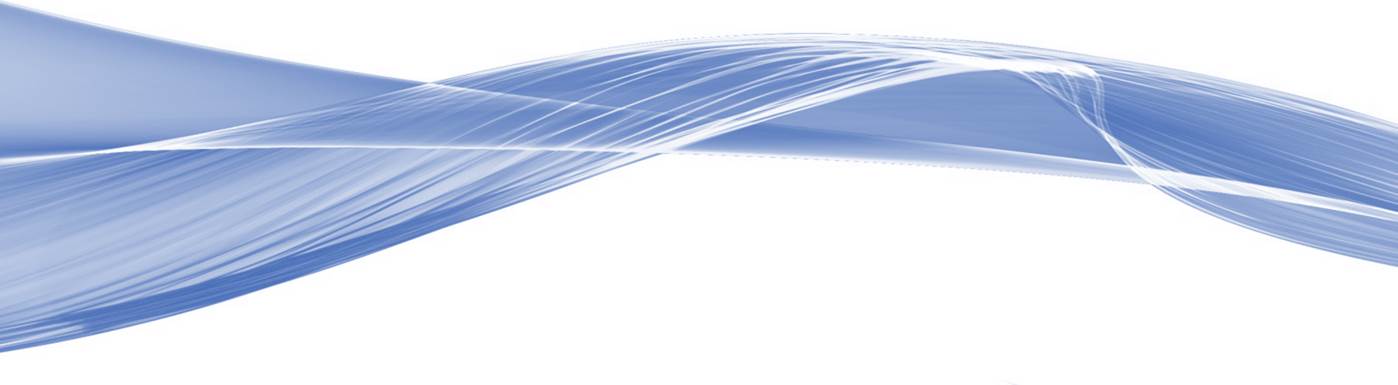
One of the big challenging in the NDE/NDT industry is detection of underfilm corrosion. The onset of corrosion at the substrate level means that it is not visible from the surface until the corrosion has progressed to a stage where the coating has completely failed and delaminated from the substrate. Therefore, early detection of underfilm corrosion is key to minimizing the damages and subsequent cost of repairs. Below is an example of how our OCT technology can be used to detect corrosion under a 369 µm thick layer of white high gloss alkyd enamel.
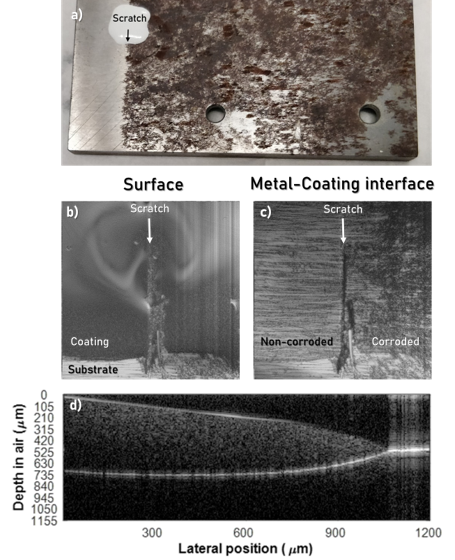
Figure 1: Detection and imaging of corrosion underneath 369 µm of high gloss coating. (a) Sample overview. (b) Surface image near the edge of the coating. (c) Sub-surface image at the same location as (b), clearly identifying corrosion underneath the coating. (d) Cross-sectional image of the edge of the coating.
Case 2: Monitoring wet film thickness
Another challenge with coating inspection is monitoring of wet film thickness. Often, wet film thickness is measured just after application of the paint using contact tools that leave marks, have low resolution, and require subsequent cleaning. Since our OCT system is non-contact, it can monitor the wet film thickness during during curing, providing information about the temporal dynamics. Below is an example of the measured wet film thickness of a blue anti-fouling hull paint during curing.
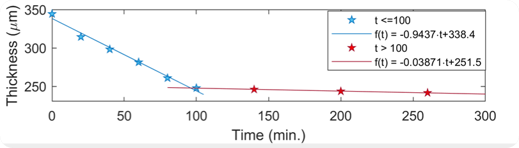
Figure 2: Measured film thickness during curing of a blue commercial anti-fouling hull coating.
Case 3: Automotive paint inspection
We were approached by a company working in the automotive sector, that were interested in performing inspection on their paints using OCT. In this example the sample was an aluminium plate pre-treated for improved adhesion that was then applied a primer and top coating (see Figure 1.1). The top coating contained ceramic flakes to give it a sparkling look.

Figure 3: Sketch of the automotive paint sample layer structure.
In this case, the company was interested in the following:
- Layer thicknesses
- Uniformity
- Defects
First, we look at the layer thicknesses. Figure 3 shows the maximum intensity signal in the cross-section of a random area on the sample over a 3x3 mm area. This correspond to 1.000 superimposed images. This was done to capture signals from the ceramic flakes in the top coating, since the contrast between top coating and primer in this case was not visible for this type of coating. This allowed us to give an estimate of the boundary between the top coating and the primer, based on the deepest observation of flakes. The line in the top is the boundary between air and top coating, and the bottom line is the boundary between the primer and the aluminium substrate. The thin metal adhesive layer is not observed, so it is assumed to be either less than 10 microns thick or very similar to the primer.
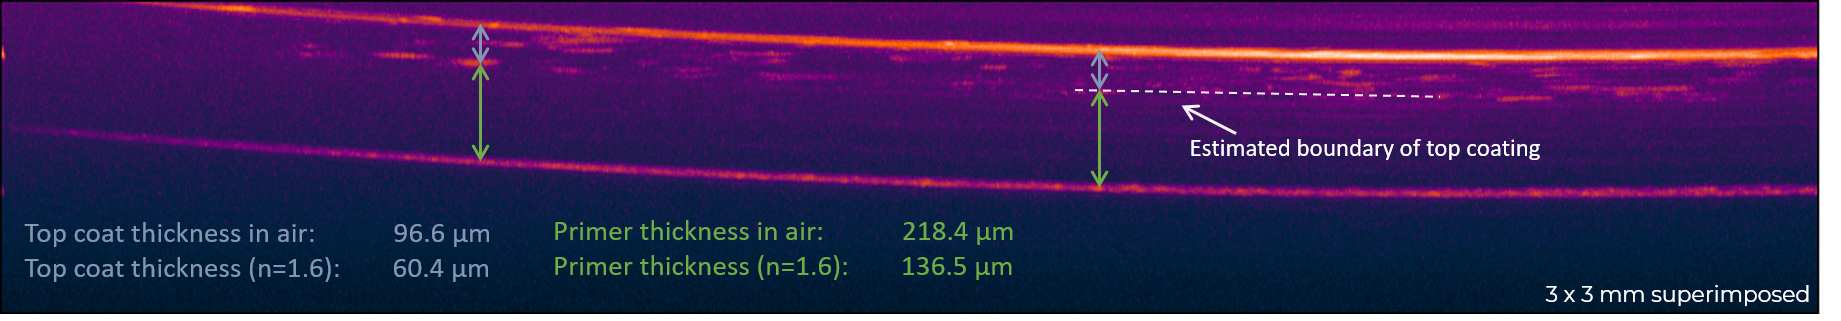
Figure 2.2: Cross-sectional view of a 3x3 mm scan of a random area on the sample showing the extend of the top coating and primer layers.
Case 3: Maritime coatings (coming soon)